Originally published on LinkedIn, July 28, 2026
In a commodity cost curve, the producers at risk sit at the top right. They are the high-cost operators, and when the price falls they are the first casualties.
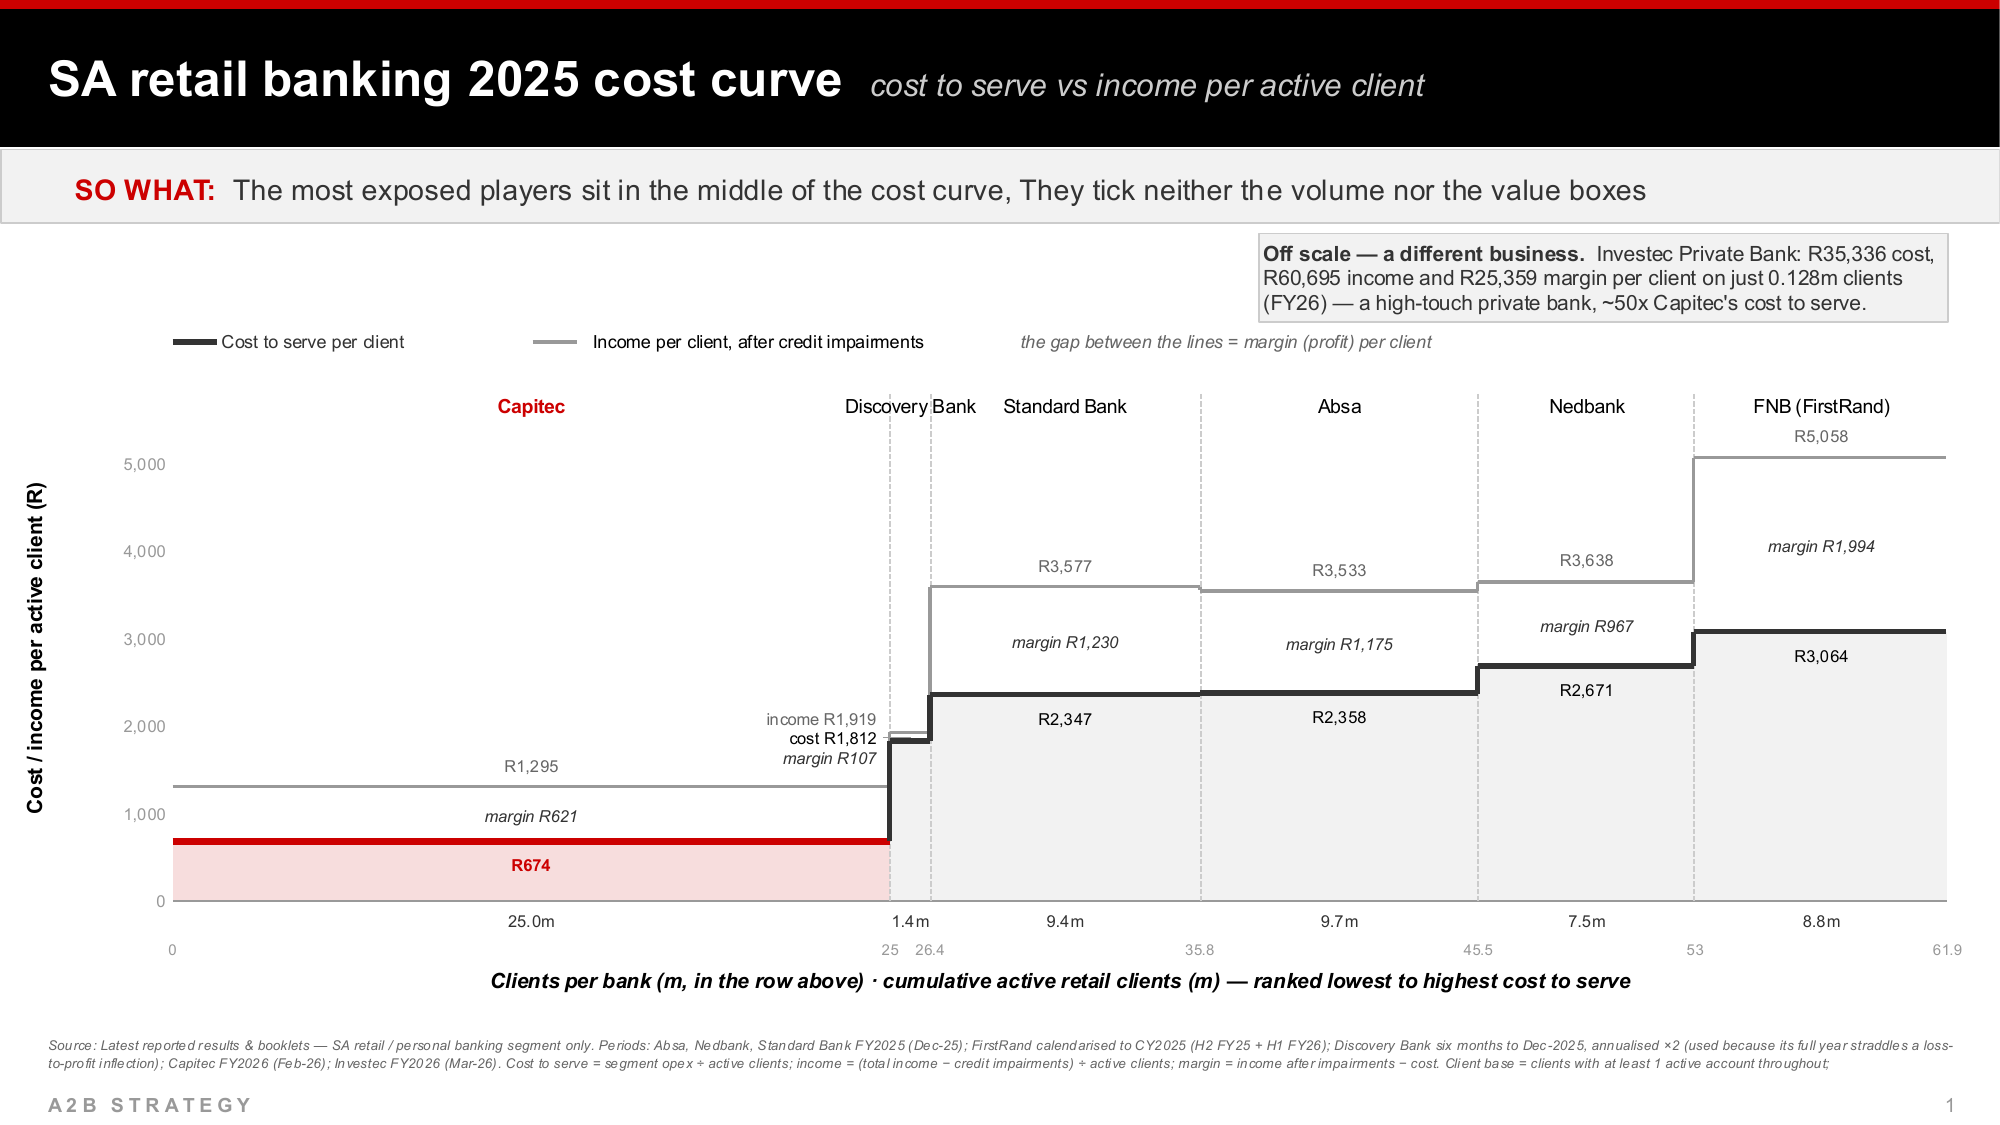
South African retail banking does not work like that. On the curve below, the most exposed players are not the expensive ones at the right-hand end – those have the pricing power to justify their costs. The exposed ones sit in the “meh-too” middle, where the cost base is high, the margin is slim, and there is no defensive structural moat.
The method, briefly
I have produced a commodity-type cost curve to better inform the nuances of retail (ie personal and private only) banking in South Africa and how it is likely to evolve. Each bank is a step: the width is its active customer base, the height is its cost to serve one customer for a year. In the absence of a uniform commodity price, the “price” line is NIR plus net interest income after credit impairments – which matters, because it is the only way to compare Capitec’s unsecured model with a secured lender on a like-for-like basis. Data is Calendar 2025 or the closest equivalent. The full technical note is at the bottom, for those who want it.
The two poles: Capitec and FNB South Africa
As one might expect, Capitec is the standout feature of the competitive landscape. Its margin might be modest, but its cost base is a step-change lower. It is going to face two points of drag going forward.
First, the opening up of the payments landscape is potentially going to erode some contributors to NIR margin, which hurts Capitec more than others given its reliance on NIR. That reliance is in fact starker than the headline split suggests. Because Capitec carries a far heavier credit impairment charge, NIR accounts for 67% of its net revenue after impairments — against 56% at FNB, 51% at ABSA, 46% at Nedbank and 44% at Standard Bank. It is the most payments-exposed bank in the country by a distance.
Second, the emergence of new competitors in its hitherto largely undisputed “territory” is going to hamstring the explosive customer growth that has seen it occupy so much of the x-axis. More than offsetting that though are the potential growth vectors — switching to main banked, cross-sell, balance sheet growth and potentially dabbling in the mass affluent space (where there are 4 boxes to tick and with a little imagination they are already there). In other words considerable runway remains in Retail (and Business and Insurance are already major growth vectors outside Retail) to raise its margin toward the R967 to R1,230 that Standard Bank, ABSA and Nedbank earn today.
At the other pole, FNB has been on a different playing field to the other legacy banks. A pre-tax margin of almost R2,000 per customer is roughly 75% above the average of its legacy competitors. This is no accident – concerted, systematic upsell and cross-sell for over 15 years built around a “main-banked” strategy, reinforced by its rewards programme, have yielded an extraordinary outcome, best illustrated by it having 1.7m “Private” banking customers (when the total market size is only 1 million customers). Even so, costs too, are higher than its competitors.
The two poles are worth holding side by side, because they arrive at almost the same place by opposite routes. Capitec’s 25 million customers at roughly R620 of margin each is a pool of about R15.5bn. FNB’s 8.8 million at almost R2,000 each is about R17.6bn. Volume and value, same answer.
FNB’s challenge is that there are only so many customers that can be moved into the Private Banking space, and I would posit that that runway must be nearly exhausted (full disclosure, I would have said that a few years ago and, much as with my Capitec share price “doomsdaying”, am happy to be wrong). The restructure underway may unlock scale efficiencies, and if they embrace AI, solutioning and service at a customer level can be improved.
But FirstRand’s non-retail businesses do not offer an obvious growth path either. RMB – Rand Merchant Bank is a fine franchise at roughly a quarter of group earnings, but meaningful growth opportunities seem limited. The UK is actively being sold off and the rest-of-Africa footprint is half that of Standard Bank’s. Unless that changes, cost retrenchment must come into focus, in Retail and beyond.
The squeezed middle: Standard Bank, ABSA and Nedbank
I was quite surprised on this view to see how closely these three banks line up. Allowing for lower customer numbers at Nedbank one is looking at almost exactly the same picture. The prognosis is not good – in the absence of innovation, a step-change in upsell and/or cross-sell, or a step-change reduction in costs, new entrants and more aggressive actions by incumbents are going to further erode retail margins.
Ultimately, there must be consolidation. Standard Bank is the best insulated locally, owing to its superb Investment Banking franchise (to mischievously call things as they are, they are already the JP Morgan of Africa), which is close to half of group headline earnings. It is the likely “consolidator”. But insulated is not immune: its retail business faces exactly the same margin compression as Nedbank’s, it is simply better hidden inside the group number.
And that means Nedbank and ABSA are the two most likely to find themselves on the wrong side of the meal table. (Why only one? My hypothesis – and I stress it is mine, not a regulatory signal – is that the Regulator would allow for only one Tier 1 M&A action. The emergence of Capitec and several new players would probably provide the SARB with comfort that its previous resistance to a merger or acquisition could be lowered at least once.) It is worth noting that both are currently looking north to supplement home base: Nedbank is acquiring 66% of Kenya’s NCBA, and ABSA is pursuing deals in Kenya and Tanzania. Buying growth offshore is the attempted alternative to being bought at home.
Digital Discovery
The challenge for any new digital player is “distribution”. Getting to break-even is non-trivial for Discovery, but marginal costs for a digital bank are close to zero – so the arithmetic turns fast once scale arrives.
Discovery has targeted over 2 million clients by financial 2029, just under 50% up from its financial year-end. On today’s cost base that alone takes average cost-to-serve from about R1,810 to roughly R1,270. But even before scale benefits are realised Discovery is already second only to Capitec on the curve. (I suspect some Vitality acquisition and reward costs are hidden in the Centre but as transparency improves one will be able to offer more informed commentary.)
Of more concern to incumbents is the segment Discovery Bank plays in — (mass) affluent and middle income. As Discovery moves beyond its secondary reward-status card to primary account, income per customer is going to close on, and then pass, the R3,500+ that Standard Bank, ABSA and Nedbank each earn per customer today. And this will be at the expense of the Legacy 4 banks.
Investec
There is no place for Investec on this cost curve, it is literally off the scale. With only 128k customers, the cost-to-serve each of them is over R35k annually. But that’s the joy of a proper Private Banking model: income exceeded R60k, which gave margins of R25k (and this excludes additional Wealth and Investment margins). This has been a really good niche business – I have never heard an Investec customer complain about their service.
Up until a year ago, if one had to level a criticism, it would have been that in terms of growth strategy they had been asleep at the wheel. It is helpful that they have now targeted customer growth, and the ambition is specific: roughly 122,000 additional South African clients on top of the existing 128,000, and around R3bn of additional operating profit by 2030. The target segment is the affluent — households earning R800k to R1.5m — rather than the true private-banking client they have built the business around. That will erode margins, but it will hopefully insulate their longer term customer base with a pipeline that previously looked modest. This is non-trivial given that the Legacy 4 banks and more particularly Discovery are targeting this space aggressively.
I might also observe that there was a time when RMB – Private Bank and Investec were natural competitors, especially in terms of premium service. Over time, the Rolex that was RMB Private Bank might have the same outward appearance but now operates on a quartz mechanism – efficient but not bespoke nor fulfilling brand potential. Given limited growth options, FirstRand could do worse than untether RMB Private Bank and let it truly be a “second horse” in the race.
New entrants in personal banking
There is way too little data to make predictions about the primary new entrants, Pepkor’s plusb and GoTyme Bank. The good news for each of them is they will almost certainly clear the first hurdle, namely scale of customers.
I have deliberately confined this to those two. OM Bank, Bank Zero, Shoprite’s Money Market, Postbank and MTN’s licence application are all real and all worth watching – but none of them yet changes the shape of the curve. plusb and GoTyme do, because both arrive with distribution already built.
plusb has a five-year target of 1.8m primary-banked customers – so by 2032 – which should be attainable given their existing pool of finserv customers and distributive reach of 6,500+ stores. And to set up a digital bank for under R1 billion sounds too good to be true, but it isn’t; the number has since been revised down to R920m. The devil is going to be in the detail. If you want to put dedicated staff in those 6,500 stores, your costs escalate quickly. If you want a call centre to handle any queries in x languages remotely for a potentially unsophisticated customer base, the service (resolution) experience is going to be bad. The intended focus on attracting salaries and income is perfect, but then not earning fees on this and focusing on lending income and VAS leaves you vulnerable to one bad credit cycle. Pepkor’s fintech play is going to be very interesting to watch.
Finally, in the absence of data of substance it would be remiss of me not to mention Revolut, which applied for a licence in November 2025 and is targeting launch by 2028. Globally they are entering markets with very clever lead offerings and the word-of-mouth is substantively positive. As a digital bank they too are largely going to be a marginal-cost-equals-zero bank, with average costs lower based on shared platform costs and IP across their country-specific offerings.
Which brings me to a kiosk in Cresta
I happened to stop at a GoTyme Bank kiosk in Cresta, and opened a new account. Holy Smokes! In 5 minutes I had been KYC’d, issued an activated and named card, downloaded the App, and transferred money in. This is the literal new benchmark for account opening. My youngest, briefly home from Europe, did the same and was equally blown away.
Customer numbers are fuzzy. They report over 12m in South Africa, but a number I trust is take-up of the new App: in May the CEO was quoted as saying 1.15m million customers had deliberately and of their own volition migrated to the new App since the January relaunch (and I have seen a July number of 4million!!!!) . Keep an eye on it – a digital bank that gets scale can do really well. A cautionary note is required; given its accumulated losses of over R7bn its “going concern” status is not a gimme. Whilst the SA equity market does not have the race-to-scale cash-burn risk tolerance of the US, this race is not yet run. ARC, Sanlam (indirectly, through its 25% of ARC Financial Services) and Nubank would all rather it survive, and further equity injections or debt-for-equity conversions might reasonably be expected in a worst case scenario.
That five-minute account opening is the whole argument in miniature. Nothing about it is expensive, and nothing about it is defensible by a bank whose cost base include massive infrastructural overheads.
So what
The lower end of the cost curve is going to become more crowded, as new entrants that are either 100% digital or digitally strong and footprint light – but with a sizeable customer base already – enter the market. Capitec’s margins are likely to expand further. And the players most at risk are not the expensive ones; they are the ones in the middle with nothing to point at.
That said, the global economic backdrop cannot be discounted. The “newbies” are not yet safely established. One market wipeout resulting in higher rates and a flight to safety, or big hits on an “adventurous” unsecured loan book, would render them stillborn.
Outside of growth, innovation and consolidation plays, there is one “no regrets” strategy for legacy players, and that is cost retrenchment. Banking has been an astonishingly good employer through the Global Financial Crisis and Covid. Boring market fundamentals, and not AI (yet), are probably going to make it less so.
Method note, for the technically inclined
This has been done for the seven primary banks in South Africa using Interim and Annual reports’ data that best aligns to a Calendar 2025 view. For Discovery Bank an exception has been made and the 6 months to December 2025 data has been annualised. It is fast-growing and this gives the most representative point-in-time view.
A cost curve needs “production” numbers and I have used “unique active bank account holders” per bank. Ideally one should use “main-banked” numbers to eliminate customer duplication, but only Capitec and Nedbank report these. Even FirstRand, which has long held this metric as its strategic core, does not actually put the number out in the public domain. It does matter: the ratio is 39.6% for Capitec, 51.7% for Nedbank, close as dammit to 100% for Investec, and probably between 50% and 65% for the other legacy banks. Nonetheless, so long as one makes allowances in interpretation, I do not think this is too serious.
Second, in the absence of a uniform commodity price, I have combined NIR and net interest income after credit impairments. This was specifically done to compensate for Capitec having a substantively higher credit loss ratio (given its reliance on unsecured lending), to allow for pre-tax operating margin comparability per customer.
Finally, costs are SA-based segment-specific operating spend. So where more costs are allocated at the centre (historically ABSA) or IT spend is “peanut-buttered” unfavourably there will be nuanced differences, but the basic picture does not change.


Leave a Reply